This sample dealership delivered 96 units against 600 total leads last month — a 16% blended closing ratio, below the 20-30% industry benchmark range for franchise dealerships. The gap is not evenly distributed: walk-in performance sits inside the healthy range, while web lead conversion is the primary leak. Front-end gross per unit also trails the blended industry reference by $419/unit. Based on the illustrative reference assumptions used in this sample, the combined estimated monthly gross exposure is $89,880–$214,020. This is an opportunity estimate — not a forecast, guarantee, or conclusion about the cause of the variance. This preview covers Sales and Finance in full — Service and BDC are included in your full Audit.
| KPI | Dealer | Benchmark | Gap | Owner |
|---|---|---|---|---|
| Units Delivered / Month | 96 | 120-180 | -24 to -84 units | Sales Manager |
| Closing Ratio (Blended) | 16% | 20-30% | -4 to -14 pts | Sales Manager / BDC Manager |
| Closing Ratio — Walk-In | 30% | 30-40% | In range (low end) | Sales Manager |
| Closing Ratio — Web Lead | 10% | 15-22% | -5 to -12 pts | BDC Manager |
| Front-End Gross / Unit (Blended) | $1,650 | $2,069 | -$419/unit | Sales Manager / GM |
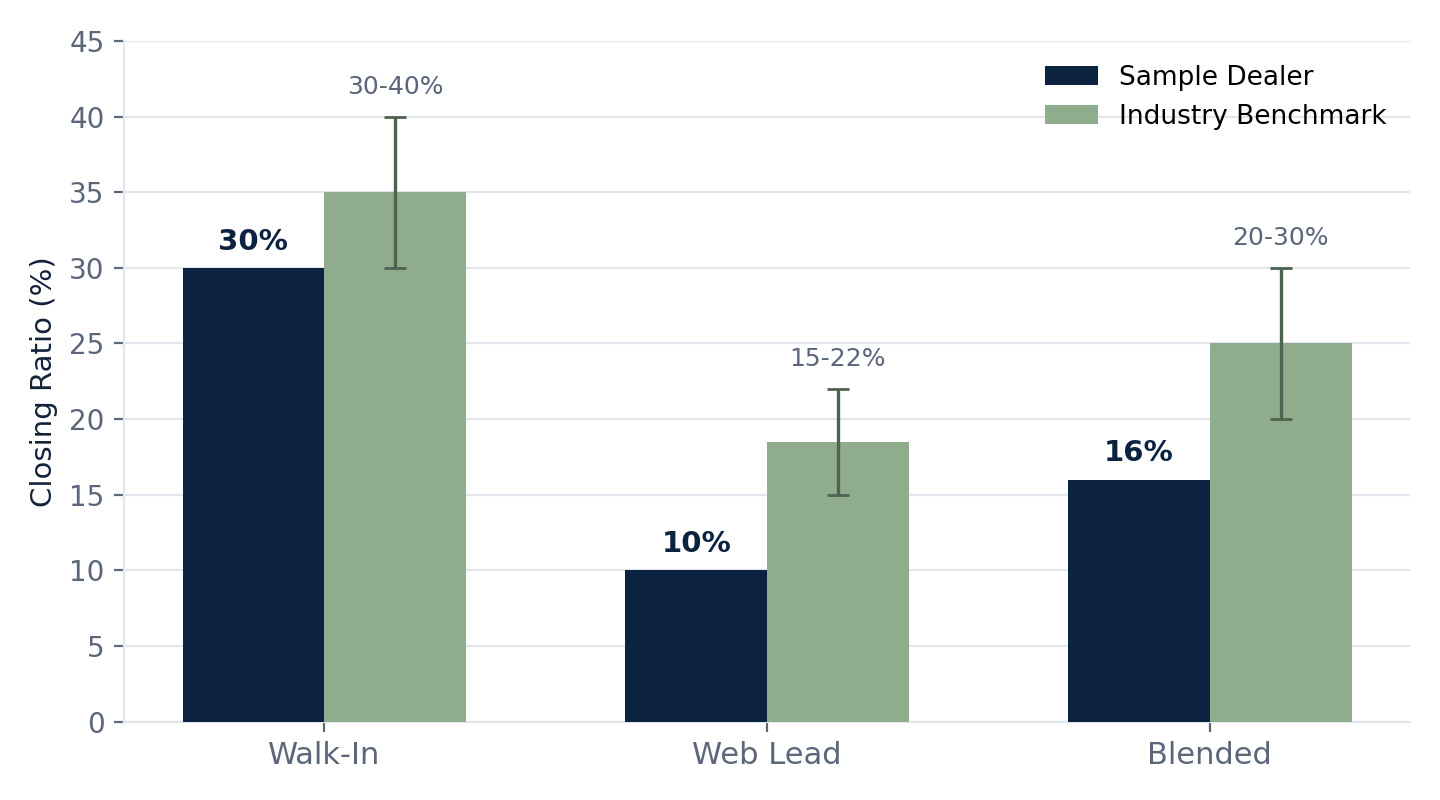
The dealer's walk-in closing ratio (30%) sits at the floor of the industry benchmark range, but web leads make up 70% of total volume (420 of 600) and convert at less than half the healthy rate — 10% vs. a 15-22% benchmark for internet leads at mid-line franchise stores. This is the single largest lever available: closing web leads at the low end of benchmark (15%) alone would add 21 units/month without any change in lead volume or walk-in performance.
| Lead Source | Volume | Closes | Closing Ratio | Benchmark |
|---|---|---|---|---|
| Walk-In | 180 | 54 | 30% | 30-40% |
| Web Lead | 420 | 42 | 10% | 15-22% |
| Total / Blended | 600 | 96 | 16% | 20-30% |
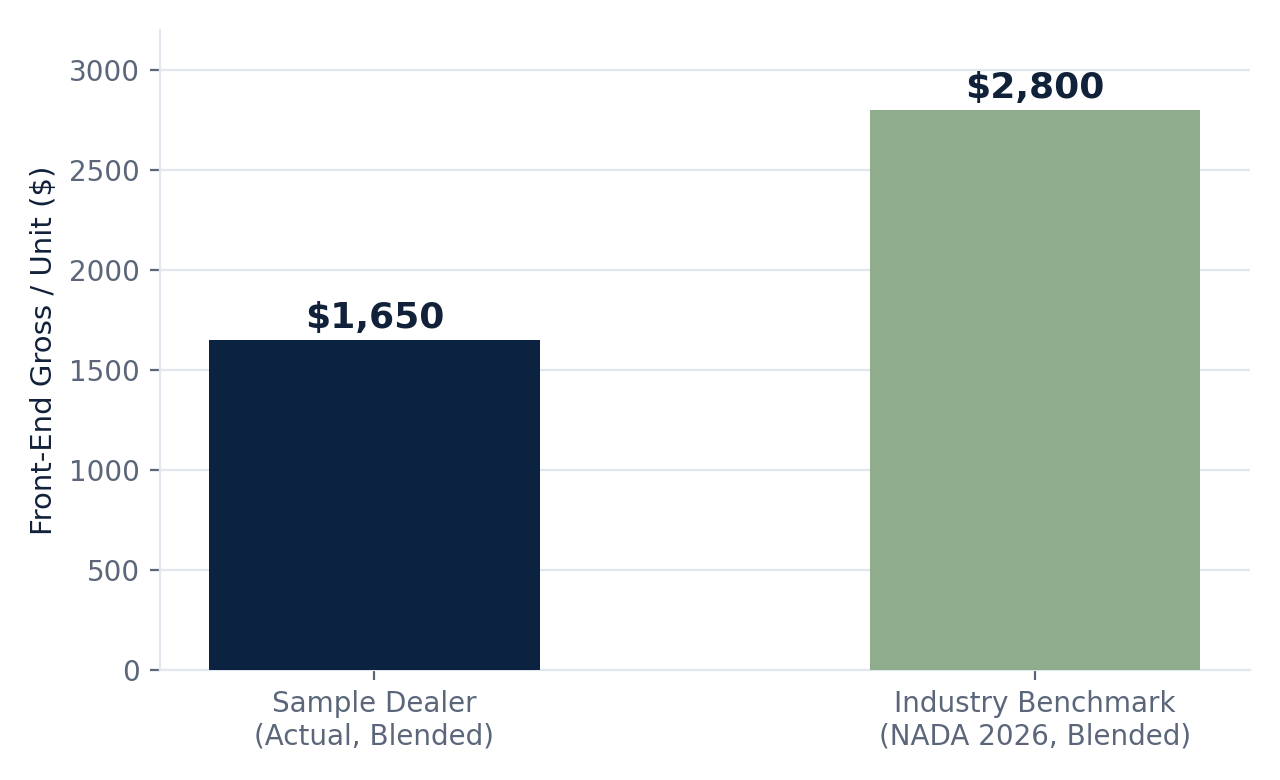
Blended front-end gross per unit at the sample dealer is $1,650, against a blended industry reference benchmark of $2,069 — a 20% shortfall per vehicle. Applied across the 96 units delivered this month, that gap alone represents $40,224 in front-end gross left on the table before accounting for missed units.
Applying the industry blended closing ratio range to the dealer's actual 600-lead volume:
| Scenario | Target Closing Ratio | Target Units | Actual Units | Missed | Opportunity |
|---|---|---|---|---|---|
| Benchmark Floor | 20% | 120 | 96 | 24 | $49,656 |
| Benchmark Ceiling | 30% | 180 | 96 | 84 | $173,796 |
Combined with the $40,224/month front-end gross-per-unit gap on units already delivered, total monthly gross exposure ranges $89,880–$214,020 — or roughly $1.1M–$2.6M annualized at current volume, before any lead-mix growth.
The data confirms that web-lead conversion is the highest-priority sales variance in this sample. It does not, by itself, prove whether the cause is lead quality, response speed, contact discipline, appointment-setting process, manager follow-up, or sales-conversation execution.
Following the Audit, the DealerVariance Executive Assistant prepares the next leadership conversation by organizing the evidence, identifying what must be validated, and drafting the first accountable correction plan.
| Executive Assistant Output | Applied To This Sample |
|---|---|
| Priority brief | Web-lead conversion is 10% versus a 15–22% reference range; the low-end opportunity is 21 additional units per month at current lead volume. |
| Validation questions | What is first-response time by source? What percentage of leads receive a complete contact attempt sequence? What is appointment set, shown, and sold by source? Is lead quality materially different by provider? |
| Accountable review | BDC Manager validates contact and appointment process; Sales Manager validates handoff, appointment-show, and showroom close process; GM reviews evidence and approves the corrective focus. |
| Action-plan draft | Define one priority metric, one accountable owner, a validation deadline, a targeted management action, and the next Correction Check-In. |
| Correction review | Remeasure web-lead closing, appointment show rate, and front-end gross per unit against the agreed baseline. |
- Pinpoints the leak by lead source, not just a blended average — so a 16% overall close rate doesn't hide that web leads, 70% of this dealer's volume, are converting at less than half the healthy rate.
- Prices the gap in missed units and dollars, not soft percentages — turning a KPI variance into a monthly number a GM or dealer principal has to act on.
- Reassesses approved dealership data against the applicable DealerVariance reference ranges whenever the agreed data package is updated.
- Assigns an owner to every gap — Sales, F&I, Service, or BDC — so the fix has a name attached to it, not just a department-wide average.
- Works from the financials and scorecards you already pull each month — nothing to change in how the store operates today.
This sample examines only sales conversion and front-end gross. A full Executive Benchmark Audit expands the review across the agreed dealership areas, identifies the priorities that warrant leadership attention, and establishes the baseline for an ongoing Executive Assistant workflow.
Would it be useful to see which performance variance in your dealership deserves executive attention first — and what the data says to validate before you act?
Methodology & Sources
Sample dealer figures (leads, closes, gross per unit) are illustrative and constructed to demonstrate DealerVariance's benchmarking output — they are not drawn from a live DMS feed. Benchmark figures are drawn from the following DealerVariance internal reference sources, corroborated against third-party data where noted:
1. Closing ratio reference range (20-30%) reflects DealerVariance's internal composite range for franchise dealers, not an independently published external benchmark; internet vs. walk-in decomposition per source 4 below.
2. Front-end gross per unit reference of $2,069 is an illustrative 50/50 blend of DealerVariance's internal new-vehicle ($1,800) and used-vehicle ($2,337) reference figures — an assumed even split, since no real new/used unit-mix weighting was available for this sample. The new-vehicle figure reflects the import/mid-line franchise tier used in this sample profile; a separate luxury-tier reference ($5,679) exists internally and applies to luxury-segment stores, not this profile. Corroborated by Haig Partners Q1 2026 Haig Report (new vehicle GPVR $2,881).
3. Healthy monthly unit volume for a franchise mid-line single point (10-16 units/salesperson-equivalent store benchmark scaled to dealership volume context) reflects DealerVariance's internal reference range, not an independently published external benchmark.
4. Walk-in vs. internet lead closing ratio reference ranges (internet: 15-22% mid-line franchise, 20-28% luxury; walk-in typically 30-40%) reflect DealerVariance's internal reference ranges, not an independently published external benchmark.
5. Gross opportunity = missed units × $2,069 illustrative blended reference front-end gross per unit (see item 2 for methodology).